The Global Shipping Report
March U.S. Container Imports Show Strong Growth Despite Escalating Tariffs
In March 2025, U.S. container imports continued to perform well, increasing 6.3% over February and 11% year-over-year. While part of the growth reflects the additional business days in March, it also reinforces the strong performance at the beginning of the year in January when volumes surpassed 2.4 million TEUs. March’s total of 2,380,674 TEUs marked the third-highest volume ever recorded for the month, trailing only March 2022 and March 2021. Notably, March also saw a shift in port dynamics, with East and Gulf Coast ports overtaking West Coast ports in market share for the first time in nine months. At the same time, transit delays improved significantly across all major ports, suggesting that infrastructure and processing capacity are keeping pace with rising volumes.
In March 2025, U.S. imports from China totaled 762,830 TEUs, representing a 12.6% decline from February yet a 9.4% increase over the same month last year. The drop follows the implementation of a 10% U.S. tariff on February 4 and an additional 10% on March 4. While March volumes remain well below the July 2024 peak of 1,022,913 TEUs, China continues to be the U.S.’s top maritime trade partner, though escalating tariffs could disrupt volumes in the months ahead.
Descartes’ April logistics update reports strong U.S. container import performance, despite rising trade-related and geopolitical challenges. March saw a solid rebound in volumes, continuing the positive momentum at the start of the year. This growth came in the face of increasingly volatile global conditions, including the escalation of U.S. tariff policy against key trade partners. This update emphasizes that evolving trade policies, shifting port dynamics, and ongoing instability in the Middle East and Eastern Europe are complicating global supply chains. As the logistics environment grows more unpredictable, businesses face heightened risks of disruption.
In this Article...
- U.S. container imports remain strong amid escalating tariff rates.
- U.S. imports from China decline in February 2025 but grow year-over-year.
- East Coast ports overtake West Coast in market share for the first time in nine months.
- Port delays improve across East and West Coast ports in March.
- Gulf Coast imports rebound in March following February decline.
- Rising trade tensions and escalating tariffs heighten risks to global trade.
- Red Sea shipping disruptions persist amid fragile ceasefire and renewed tensions.
- Managing supply chain risk: what to watch in 2025.
- Consider recommendations to help minimize global shipping challenges.
U.S. container imports remain strong amid escalating tariff rates.
In March 2025, U.S. container import volumes continued to perform well, totaling 2,380,674 TEUs for an increase of 6.3% over February (see Figure 1). Compared to March 2024, March 2025 imports posted an 11% increase and were 33.9% higher than the same month in pre-pandemic 2019. For the first three months of 2025, total volumes are 8.4% higher than the same period in 2024.
Figure 1: U.S. Container Import Volume Year-over-Year Comparison
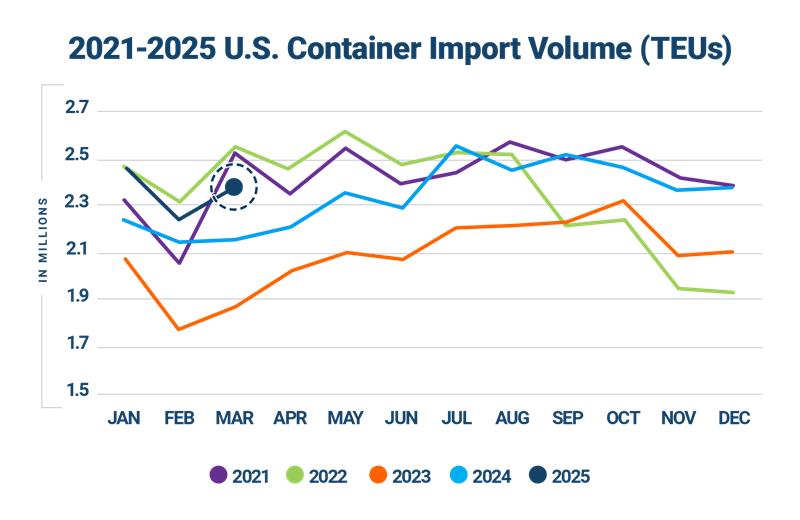
Source: Descartes Datamyne™
March import volume was the third highest on record for the month, trailing March 2022 by 177,347 TEUs and March 2021 by 145,681 TEUs (see Figure 2). Observing the seasonal, post-pandemic trend of February-to-March increases, March 2025 increased by 141,732 TEUs (6.3%) over last month.
Figure 2: February to March U.S. Container Import Volume Comparison

Source: Descartes Datamyne™
In March 2025, container import volumes at the top 10 U.S. ports increased by 116,529 TEUs overall (see Figure 3), rebounding from an 11.2% drop (234,604 TEUs) last month. Only one port saw a volume decrease: Los Angeles (down 5.9%) though Long Beach was up only marginally (0.3%). The remaining eight ports experienced increases, with the largest volume growth at Norfolk (up 27.9%), Houston (up 19.5%) and Philadelphia (up 17.8%). Philadelphia also edged out Seattle for the last position in the top 10 for March.
Figure 3: February 2025 to March 2025 Comparison of Import Volumes at Top 10 U.S. Ports

Source: Descartes Datamyne™
U.S. imports from China decline in February 2025 but grow year-over-year.
In March 2025, U.S. imports from China (762,830 TEUs) decreased 12.6% over February (872,779 TEUs). The top three commodity categories (HS-2 codes) for imports were HS-94 (Furniture, Bedding, etc.), HS-39 (Plastics and Articles Thereof), and HS-84 (Nuclear Reactors, Boilers, Machinery, etc.). Despite the month-over-month decline, volumes increased 9.4% (697,375) year-over-year, demonstrating ongoing demand for Chinese goods, even while down 25.4% from the all-time high (1,022,913 TEUs) in July 2024 (see Figure 4). Interestingly, China’s share of total U.S. imports in March 2025 (32.0%) was similar in both March 2024 (32.5%) and in March 2023 (31.6%). These percentages also mark the smallest monthly share in each of the three years and are all significantly lower than the peak monthly share of 41.5% recorded in February 2022.
This year, volumes in March were likely influenced in part by the cumulative effect of new U.S. tariffs on Chinese goods. A 10% tariff was imposed on February 4, followed by an additional 10% tariff on March 4, bringing the total to 20% on many Chinese exports. The full impact of these tariff changes may further unfold in the coming months as importers adjust sourcing strategies and shipment schedules to mitigate rising costs.
On April 2, 2025, President Trump announced an additional 34% tariff on Chinese imports, effective April 9, raising the total tariff rate on many Chinese goods to 54%. In retaliation, China announced on April 4 that it would impose a 34% tariff on all U.S. imports, effective April 10. In response, President Trump imposed an additional 50% tariff on Chinese goods, also effective April 9, bringing the total U.S. tariff rate on many Chinese imports to 104%. However, on April 9, President Trump further increased the tariff on imports from China to 125% in order to further pressure Beijing into negotiation. These developments are expected to further impact trade volumes between the two countries in the coming months.
Figure 4: March 2024–March 2025 Comparison of U.S. Total and Chinese TEU Container Volume Relative to Chinese Import Record

Source: Descartes Datamyne
In March 2025, U.S. container import volume from the top 10 countries of origin (CoO) increased marginally by 8,857 TEUs, or 0.5% compared to February (see Figure 5). Among these countries, China saw the largest drop, down 109,949 TEUs, followed by Hong Kong (down 4,571 TEUs). All other countries in the top 10 experienced increases, with Germany (up 39.6%), Thailand (up 35.7%) and Japan (33.4%) leading the pack.
Figure 5: February 2025 to March 2025 Comparison of U.S. Import Volumes from Top 10 Countries of Origin

Source: Descartes Datamyne
Over the past six years, while China has remained by far the dominant CoO by volume for U.S. imports, Vietnam, Thailand, India, and South Korea have emerged as significant growth markets. From 2018 to 2024, Vietnam’s import volume more than doubled, rising by 131%, while Thailand (91%), India (63%) and South Korea (58%) also saw significant growth (see Figure 6). Indonesia’s import volume grew by 37%. In contrast, imports from Germany, Japan, and Hong Kong have either declined or remained flat relative to 2018 levels (see Figure 6).
These trends reflect broader shifts in global sourcing strategies, as companies increasingly diversify supply chains away from China and traditional Western suppliers toward emerging manufacturing hubs in Asia. However, the anticipated implementation of new U.S. tariffs—targeting a wide range of countries—could disrupt these patterns.
Figure 6: 2018–2024 Comparison of Import Growth for Top 10 Countries of Origin.

Source: Descartes Datamyne
East Coast ports overtake West Coast in market share for the first time in nine months.
In March 2025, East Coast ports surpassed West Coast ports in container import volume for the first time in nine months, reflecting a notable shift in trade flows. East Coast ports accounted for 43% of total U.S. imports, up 2.4% from February, while West Coast ports fell to 39.4%, down 3.4% from February. The combined share of the top 10 U.S. ports declined slightly to 82.5%, down 0.9% from the previous month (see Figure 7).
This change may be partially driven by the February/March combined 20% tariff on Chinese imports disproportionately impacting West Coast ports, which handle the majority of U.S.–Asia container traffic. As tariffs on Chinese goods are expected to rise to 125% in April, this trend may continue as companies work to mitigate rising costs amid an evolving tariff landscape.
Figure 7: Volume Analysis for Top Ports, West Coast Ports and East and Gulf Coast Ports

Source: Descartes Datamyne™
Port delays improve across East and West Coast ports in March.
In March 2025, transit delays improved across all top 10 U.S. ports. The largest decreases were at Oakland (down 2.1 days), Los Angeles (down 1.9 days), and Savannah (down 1.7 days), signaling easing congestion (see Figure 8). Several East Coast ports, including New York/New Jersey, Charleston, and Norfolk also saw meaningful improvements. The Gulf Coast port Houston experienced a modest reduction of 0.4 days, while Tacoma and Seattle saw smaller declines of 0.3 and 0.2 days, respectively.
Figure 8: Monthly Average Transit Delays (in days) for the Top 10 Ports (Jan. 2025 – Mar. 2025)

Source: Descartes Datamyne™
Note: Descartes’ definition of port transit delay is the difference as measured in days between the Estimated Arrival Date, which is initially declared on the bill of lading, and the date when Descartes receives the CBP-processed bill of lading data.
Gulf Coast imports rebound in March following February decline.
In March 2025, Gulf Coast container imports rose to 233,816 TEUs, marking a strong 14.4% increase over February’s 204,421 TEUs (see Figure 9). This recovery follows February’s 10.9% drop over January, which had brought volumes to their lowest level since November 2023. March volumes bring Gulf Coast imports back in line with recent historical averages, just slightly above the 12-month average of approximately 225,632 TEUs.
Figure 9: April 2024 to March 2025 U.S. Gulf Coast Container Imports


Director, Industry Strategy, Global Trade Intelligence, Descartes Systems Group

The Must-Read Guide on U.S. Maritime Ports

Gain deep insights into 2023 U.S. imports and learn how to mitigate risks in your supply chain.
Stay Informed. Download the Report.
How Descartes Can Help
Descartes Datamyne delivers business intelligence with comprehensive, accurate, up-to-date, import and export information.
Our multinational trade data assets can be used to trace global supply chains and our bill-of-lading trade data – with cross-references to company profiles and customs information – can help businesses identify and qualify new sources. Ask us for a free, no obligation demonstration of our data on a product or trade commodity of your choosing – and keep the custom research we create with our compliments.